
Economics Versus Energy
Take a Wild Guess Who Wins...

Last week, we ran some numbers and came up with a back-of-the-envelope estimate for how much the current oil price spike costs Americans at the pump. Top-line number, we are looking at a minimum 4.3 % decline in after-tax income for Americans outside the top 20% of earners. Why leave out that top quintile? Because the income of the top 1% skews the averages for everyone else so badly, we had to go with the bottom four quintiles. Dr Mattson and I wrote a whole book about why economic inequality in this country is much worse than you’d think.

But enough about the broader economy, let’s talk about how the fuel situation in the country looks set to go from bad to worse. Last week, we only calculated the cost to customers if prices remained similar to what they are now, for the next six months. As noted last week, we don’t know how much longer the Hormuz closure will go on, but fuel prices certainly aren’t going down anytime soon. Even if the Strait reopens tomorrow, it will take six months to get back to 80% prior production according to Goldman Sachs. This suggests at least 2-4 million barrels a day won’t be coming back online anytime this year. Those facilities took years and billions of dollars to build, and that will take as much as two years to rebuild and re-open. Iran has vowed to keep the strait closed until the US ceases military operations against them and lifts its own blockade of the strait. And even if hostilities ended tomorrow, it would take six months to clear the mines Iran laid in the strait to control ship traffic.
So, six months looks like a reasonable timeline. But there’s a catch. There’s always a catch. In this case, the catch is a supertanker-sized one, and that is that the loss of some 20 million barrels a day of exported crude oil (to say nothing of the lost liquid natural gas and fertilizer exports). This loss comes out of a total global crude production of roughly 104 million barrels a day. This math is simple enough; we’ve lost just under 20% of all oil available to the global economy. And in a world where oil is both an inelastic good, and a largely fungible one, prices have only one direction to go – up.

But here’s the worse part of an already bad story – the Arab oil embargo of 1973-74 (which lasted roughly 6 months) caused a decade of stagflation and economic disruptions from a loss of about 7% of global production. While the situations aren’t exactly one-to-one, the impact of the current closure going on 6 months would be about three times worse in terms of lost oil consumption. And in a world where energy consumption and GDP are basically tied at the hip, what this implies about economic contraction is not pretty.
Now it is true that we use energy more efficiently fifty years after the last serious oil shock. The energy production profile is quite different too, with natural gas and renewables making up much larger shares of the pie. The problem though, is that transportation fuels are essentially ALL still petroleum driven. Yes, we have hybrid and electric cars, but those make up a tiny portion of global use. For the US, the electric grid shouldn’t fail, but moving goods and people around the country will become much more expensive, and this alone will drive up prices throughout the economy. While the US is an exporter of refined oil, we are NOT, as the current regime likes to claim, energy independent. This claim can be shown to be a lie with an examination of the below information from the Energy Information Agency. In 2025, the US imported some 6.1 million barrels per day., of which 490,000 per day came from the Persian Gulf. That’s right, the current price spike comes from losing just 8% of our total imports. But wait, there’s more, and it’s worse, because of that 6.1 million barrels per day we import, 3.9 million comes from Canada and is effectively locked in, as the pipelines run south out of Alberta to the US. But the rest, the other 1.7 million barrels a day that don’t come from the Persian Gulf or Canada? That oil comes from around the world, and in a world where the oil prices is set to go up, those producers will sell to the highest bidder, and that highest bidder won’t necessarily be the US. Again, oil prices have only one direction to go, and that’s up.
But more concerning than the price shock is the likelihood of physical shortages – a true supply shock.
Combined with the logistics of moving millions of barrels of oil by sea, commercial and strategic reserves allowed oil companies and countries to cushion the lack of supply for the last ten weeks. This cushion will ease the supply shock for another two months or so, depending on where you are. Experts now expect that cushion to run out here in the US by July 4th. At that point, what happens?
For one, there won’t be enough oil to go around. Duh. For another, in many places, oil won’t be available at anything but the most exorbitant prices. It might top a thousand dollars a barrel in countries that rely entirely upon Persian Gulf imports. And what will happen to the global economy when the supply crunch hits? As mentioned earlier, energy use and economic activity move almost in lockstep – burn more exajoules, produce more goods and services. GDP goes up. Line goes up. So, what are we looking at globally?
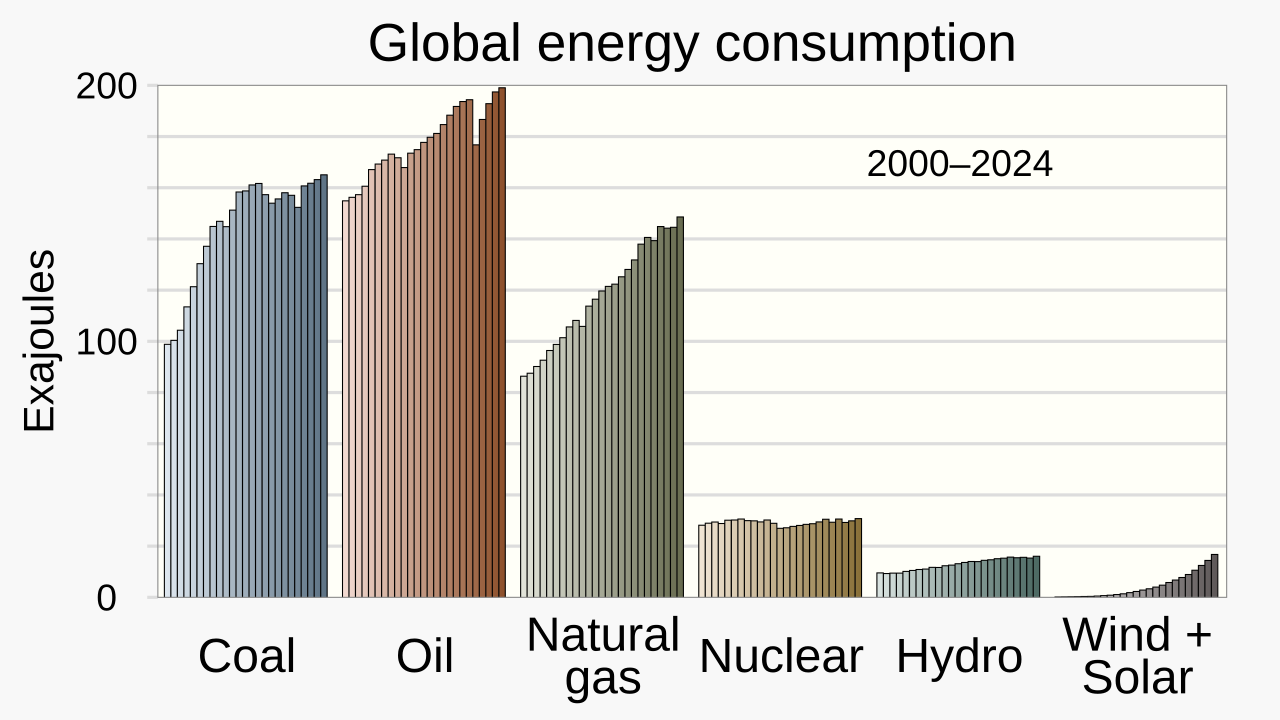
In 2024, the global economy used about 576 exajoules of energy, from all sources, but for our purposes, 200 eJs came from oil and 145 eJs came from natural gas. Without 20% of both energy sources, the global economy has lost 69 eJs of energy thanks to the closure of the Strait of Hormuz. That’s about 12% of all energy production globally, and while the relationship isn’t exactly one-to-one, A contraction of the global economy will begin when the supply shock starts, which again, is happening now in East Africa and South Asia, and rippling towards East Asia, Europe and the Americas, and whenever the strait re-opens. IF the supply shock continues for more than a few months, a 12% contraction in global economic activity will follow. For comparison, economists put global declines of GDP for the 2008-09 Great Recession and the COVID-19 Recession in the 3.5-5% contractions in economic activity as measured by per capital GDP.
Since this is a US-based blog, let’s remember that in the US, the Great Recession resulted in a 4.1% contraction of the economy and a 10% unemployment rate. And since North America will likely be the last industrial region to experience the supply shock, starting in early July, let’s use the third and fourth quarters of 2026 as a measure of the duration of the supply shock. If the supply shock lasts two quarters (six months), we will be looking at a global economic crisis two to three times worse than COVID or the Great Financial Crisis by the end of the year.